Pulsar Perf
This document describes how to use the Pulsar Perf for performance testing. For detailed information about performance tuning, see here.
Pulsar Perf
The Pulsar Perf is a built-in performance test tool for Apache Pulsar. You can use the Pulsar Perf to test message writing or reading performance.
Produce messages
This example shows how the Pulsar Perf produces messages with default options. For all configuration options available for the pulsar-perf produce command, see configuration options.
bin/pulsar-perf produce my-topic
After the command is executed, the test data is continuously output on the Console.
Output
19:53:31.459 [pulsar-perf-producer-exec-1-1] INFO  org.apache.pulsar.testclient.PerformanceProducer - Created 1 producers
19:53:31.482 [pulsar-timer-5-1] WARN  com.scurrilous.circe.checksum.Crc32cIntChecksum - Failed to load Circe JNI library. Falling back to Java based CRC32c provider
19:53:40.861 [main] INFO  org.apache.pulsar.testclient.PerformanceProducer - Throughput produced:     93.7  msg/s ---      0.7 Mbit/s --- failure      0.0 msg/s --- Latency: mean:   3.575 ms - med:   3.460 - 95pct:   4.790 - 99pct:   5.308 - 99.9pct:   5.834 - 99.99pct:   6.609 - Max:   6.609
19:53:50.909 [main] INFO  org.apache.pulsar.testclient.PerformanceProducer - Throughput produced:    100.0  msg/s ---      0.8 Mbit/s --- failure      0.0 msg/s --- Latency: mean:   3.437 ms - med:   3.328 - 95pct:   4.656 - 99pct:   5.071 - 99.9pct:   5.519 - 99.99pct:   5.588 - Max:   5.588
19:54:00.926 [main] INFO  org.apache.pulsar.testclient.PerformanceProducer - Throughput produced:    100.0  msg/s ---      0.8 Mbit/s --- failure      0.0 msg/s --- Latency: mean:   3.376 ms - med:   3.276 - 95pct:   4.520 - 99pct:   4.939 - 99.9pct:   5.440 - 99.99pct:   5.490 - Max:   5.490
19:54:10.940 [main] INFO  org.apache.pulsar.testclient.PerformanceProducer - Throughput produced:    100.0  msg/s ---      0.8 Mbit/s --- failure      0.0 msg/s --- Latency: mean:   3.298 ms - med:   3.220 - 95pct:   4.474 - 99pct:   4.926 - 99.9pct:   5.645 - 99.99pct:   5.654 - Max:   5.654
19:54:20.956 [main] INFO  org.apache.pulsar.testclient.PerformanceProducer - Throughput produced:    100.1  msg/s ---      0.8 Mbit/s --- failure      0.0 msg/s --- Latency: mean:   3.308 ms - med:   3.199 - 95pct:   4.532 - 99pct:   4.871 - 99.9pct:   5.291 - 99.99pct:   5.323 - Max:   5.323
19:54:30.972 [main] INFO  org.apache.pulsar.testclient.PerformanceProducer - Throughput produced:    100.0  msg/s ---      0.8 Mbit/s --- failure      0.0 msg/s --- Latency: mean:   3.249 ms - med:   3.144 - 95pct:   4.437 - 99pct:   4.970 - 99.9pct:   5.329 - 99.99pct:   5.414 - Max:   5.414
19:54:40.987 [main] INFO  org.apache.pulsar.testclient.PerformanceProducer - Throughput produced:    100.0  msg/s ---      0.8 Mbit/s --- failure      0.0 msg/s --- Latency: mean:   3.435 ms - med:   3.361 - 95pct:   4.772 - 99pct:   5.150 - 99.9pct:   5.373 - 99.99pct:   5.837 - Max:   5.837
^C19:54:44.325 [Thread-1] INFO  org.apache.pulsar.testclient.PerformanceProducer - Aggregated throughput stats --- 7286 records sent --- 99.140 msg/s --- 0.775 Mbit/s
19:54:44.336 [Thread-1] INFO  org.apache.pulsar.testclient.PerformanceProducer - Aggregated latency stats --- Latency: mean:   3.383 ms - med:   3.293 - 95pct:   4.610 - 99pct:   5.059 - 99.9pct:   5.588 - 99.99pct:   5.837 - 99.999pct:   6.609 - Max:   6.609
From the above test data, you can get the throughput statistics and the write latency statistics. The aggregated statistics is printed when the Pulsar Perf is stopped. You can press Ctrl+C to stop the Pulsar Perf. After the Pulsar Perf is stopped, the HdrHistogram formatted test result appears under your directory. The document looks like perf-producer-1589370810837.hgrm. You can also check the test result through HdrHistogram Plotter. For details about how to check the test result through HdrHistogram Plotter, see HdrHistogram Plotter.
Configuration options for pulsar-perf produce
You can get all options by executing the bin/pulsar-perf produce -h command. Therefore, you can modify these options as required.
The following table lists configuration options available for the pulsar-perf produce command.
| Option | Description | Default value |
|---|---|---|
| auth-params | Set the authentication parameters, whose format is determined by the implementation of the configure method in the authentication plugin class, such as "key1:val1,key2:val2" or "{"key1":"val1","key2":"val2"}". | N/A |
| auth_plugin | Set the authentication plugin class name. | N/A |
| batch-max-bytes | Set the maximum number of bytes for each batch. | 4194304 |
| batch-max-messages | Set the maximum number of messages for each batch. | 1000 |
| batch-time-window | Set a window for a batch of messages. | 1 ms |
| chunking | Configure whether to split the message and publish in chunks if message size is larger than allowed max size. | false |
| compression | Compress the message payload. | N/A |
| conf-file | Set the configuration file. | N/A |
| delay | Mark messages with a given delay. | 0s |
| encryption-key-name | Set the name of the public key used to encrypt the payload. | N/A |
| encryption-key-value-file | Set the file which contains the public key used to encrypt the payload. | N/A |
| exit-on-failure | Configure whether to exit from the process on publish failure. | false |
| help | Configure the help message. | false |
| max-connections | Set the maximum number of TCP connections to a single broker. | 100 |
| max-outstanding | Set the maximum number of outstanding messages. | 1000 |
| max-outstanding-across-partitions | Set the maximum number of outstanding messages across partitions. | 50000 |
| num-messages | Set the number of messages to be published in total. If it is set to 0, it keeps publishing messages. | 0 |
| num-producers | Set the number of producers for each topic. | 1 |
| num-test-threads | Set the number of test threads. | 1 |
| num-topic | Set the number of topics. | 1 |
| payload-delimiter | Set the delimiter used to split lines when using payload from a file. | \n |
| payload-file | Use the payload from an UTF-8 encoded text file and a payload is randomly selected when messages are published. | N/A |
| rate | Set the publish rate of messages across topics. | 100 |
| service-url | Set the Pulsar service URL. | |
| size | Set the message size. | 1024 bytes |
| stats-interval-seconds | Set the statistics interval. If it is set to 0, statistics is disabled. | 0 |
| test-duration | Set the test duration. If it is set to 0, it keeps publishing tests. | 0s |
| trust-cert-file | Set the path for the trusted TLS certificate file. | |
| warmup-time | Set the warm-up time. | 1s |
Consume messages
This example shows how the Pulsar Perf consumes messages with default options.
bin/pulsar-perf consume my-topic
After the command is executed, the test data is continuously output on the Console.
Output
20:35:37.071 [main] INFO  org.apache.pulsar.testclient.PerformanceConsumer - Start receiving from 1 consumers on 1 topics
20:35:41.150 [pulsar-client-io-1-9] WARN  com.scurrilous.circe.checksum.Crc32cIntChecksum - Failed to load Circe JNI library. Falling back to Java based CRC32c provider
20:35:47.092 [main] INFO  org.apache.pulsar.testclient.PerformanceConsumer - Throughput received: 59.572  msg/s -- 0.465 Mbit/s --- Latency: mean: 11.298 ms - med: 10 - 95pct: 15 - 99pct: 98 - 99.9pct: 137 - 99.99pct: 152 - Max: 152
20:35:57.104 [main] INFO  org.apache.pulsar.testclient.PerformanceConsumer - Throughput received: 99.958  msg/s -- 0.781 Mbit/s --- Latency: mean: 9.176 ms - med: 9 - 95pct: 15 - 99pct: 16 - 99.9pct: 17 - 99.99pct: 18 - Max: 18
20:36:07.115 [main] INFO  org.apache.pulsar.testclient.PerformanceConsumer - Throughput received: 100.006  msg/s -- 0.781 Mbit/s --- Latency: mean: 9.316 ms - med: 9 - 95pct: 15 - 99pct: 16 - 99.9pct: 17 - 99.99pct: 17 - Max: 17
20:36:17.125 [main] INFO  org.apache.pulsar.testclient.PerformanceConsumer - Throughput received: 100.085  msg/s -- 0.782 Mbit/s --- Latency: mean: 9.327 ms - med: 9 - 95pct: 15 - 99pct: 16 - 99.9pct: 17 - 99.99pct: 17 - Max: 17
20:36:27.136 [main] INFO  org.apache.pulsar.testclient.PerformanceConsumer - Throughput received: 99.900  msg/s -- 0.780 Mbit/s --- Latency: mean: 9.404 ms - med: 9 - 95pct: 15 - 99pct: 16 - 99.9pct: 17 - 99.99pct: 17 - Max: 17
20:36:37.147 [main] INFO  org.apache.pulsar.testclient.PerformanceConsumer - Throughput received: 99.985  msg/s -- 0.781 Mbit/s --- Latency: mean: 8.998 ms - med: 9 - 95pct: 15 - 99pct: 16 - 99.9pct: 17 - 99.99pct: 17 - Max: 17
^C20:36:42.755 [Thread-1] INFO  org.apache.pulsar.testclient.PerformanceConsumer - Aggregated throughput stats --- 6051 records received --- 92.125 msg/s --- 0.720 Mbit/s
20:36:42.759 [Thread-1] INFO  org.apache.pulsar.testclient.PerformanceConsumer - Aggregated latency stats --- Latency: mean: 9.422 ms - med: 9 - 95pct: 15 - 99pct: 16 - 99.9pct: 98 - 99.99pct: 137 - 99.999pct: 152 - Max: 152
From the output test data, you can get the throughput statistics and the end-to-end latency statistics. The aggregated statistics is printed after the Pulsar Perf is stopped. You can press Ctrl+C to stop the Pulsar Perf.
Configuration options for pulsar-perf consume
You can get all options by executing the bin/pulsar-perf consume -h command. Therefore, you can modify these options as required.
The following table lists configuration options available for the pulsar-perf consume command.
| Option | Description | Default value |
|---|---|---|
| acks-delay-millis | Set the acknowledgment grouping delay in milliseconds. | 100 ms |
| auth-params | Set the authentication parameters, whose format is determined by the implementation of the configure method in the authentication plugin class, such as "key1:val1,key2:val2" or "{"key1":"val1","key2":"val2"}". | N/A |
| auth_plugin | Set the authentication plugin class name. | N/A |
| auto_ack_chunk_q_full | Configure whether to automatically ack for the oldest message in receiver queue if the queue is full. | false |
| conf-file | Set the configuration file. | N/A |
| encryption-key-name | Set the name of the public key used to encrypt the payload. | N/A |
| encryption-key-value-file | Set the file which contains the public key used to encrypt the payload. | N/A |
| help | Configure the help message. | false |
| expire_time_incomplete_chunked_messages | Set the expiration time for incomplete chunk messages (in milliseconds). | 0 |
| max-connections | Set the maximum number of TCP connections to a single broker. | 100 |
| max_chunked_msg | Set the max pending chunk messages. | 0 |
| num-consumers | Set the number of consumers for each topic. | 1 |
| num-topic | Set the number of topics. | 1 |
| rate | Simulate a slow message consumer (rate in msg/s). | 0.0 |
| receiver-queue-size | Set the size of the receiver queue. | 1000 |
| replicated | Configure whether the subscription status should be replicated. | false |
| replicated | Configure whether the subscription status should be replicated. | false |
| service-url | Set the Pulsar service URL. | |
| stats-interval-seconds | Set the statistics interval. If it is set to 0, statistics is disabled. | 0 |
| subscriber-name | Set the subscriber name prefix. | sub |
| subscription-type | Set the subscription type. | Exclusive |
| test-duration | Set the test duration (in seconds). If the value is 0 or smaller than 0, it keeps consuming messages. | 0 |
| trust-cert-file | Set the path for the trusted TLS certificate file. |
Configurations
By default, the Pulsar Perf uses conf/client.conf as the default configuration and uses conf/log4j2.yaml as the default Log4j configuration. If you want to connect to other Pulsar clusters, you can update the brokerServiceUrl in the client configuration.
You can use the following commands to change the configuration file and the Log4j configuration file.
export PULSAR_CLIENT_CONF=<your-config-file>
export PULSAR_LOG_CONF=<your-log-config-file>
In addition, you can use the following command to configure the JVM configuration through environment variables:
export PULSAR_EXTRA_OPTS='-Xms4g -Xmx4g -XX:MaxDirectMemorySize=4g'
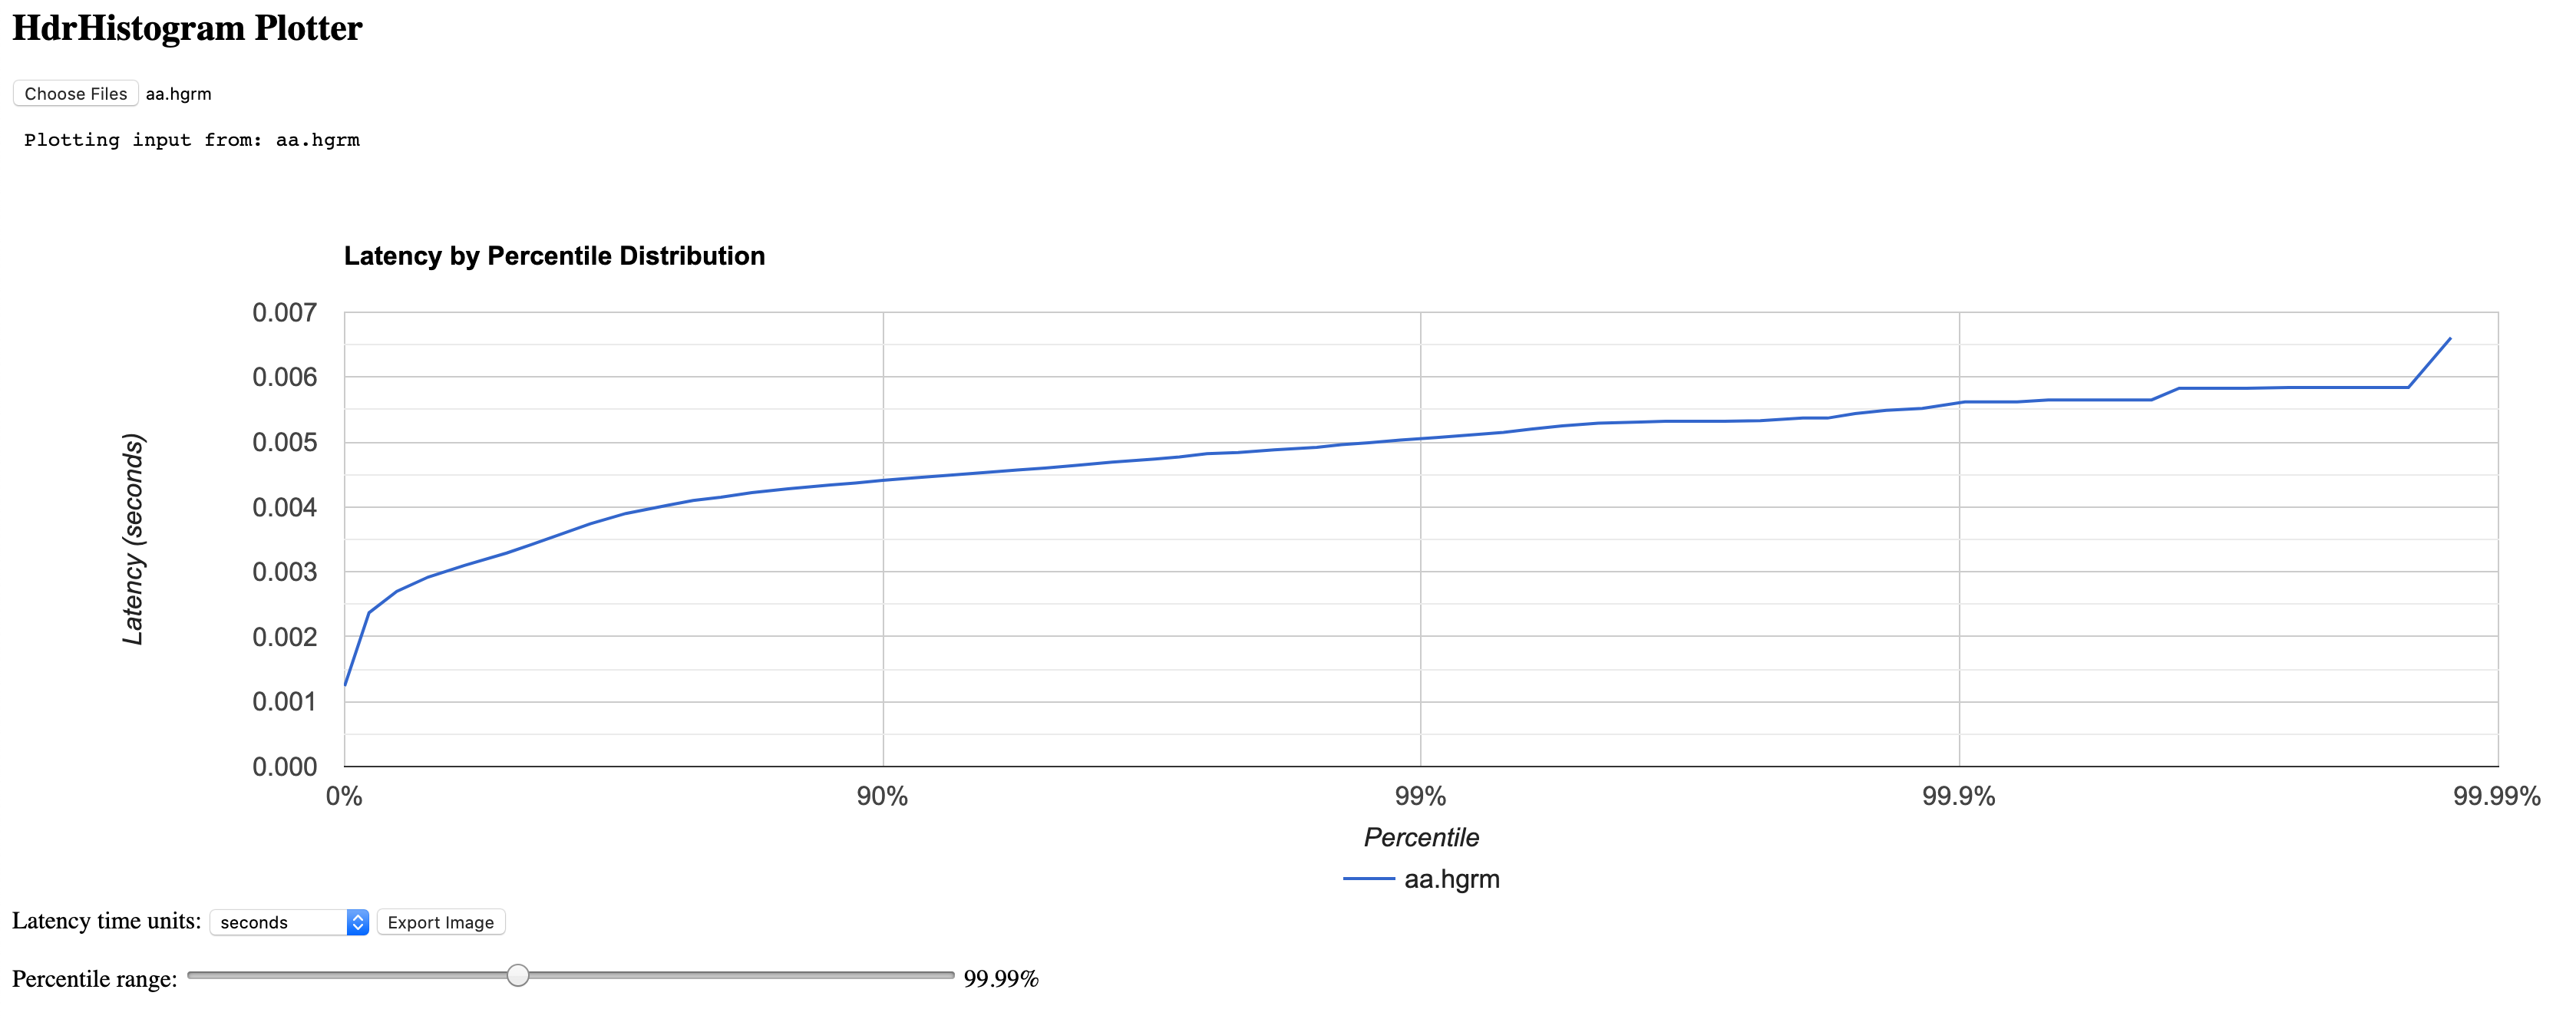
HdrHistogram Plotter
The HdrHistogram Plotter is a visualization tool for checking Pulsar Perf test results, which makes it easier to observe the test results.
To check test results through the HdrHistogram Plotter, follow these steps:
-
Clone the HdrHistogram repository from GitHub to the local.
git clone https://github.com/HdrHistogram/HdrHistogram.git -
Switch to the HdrHistogram folder.
cd HdrHistogram -
Install the HdrHistogram Plotter.
mvn clean install -DskipTests -
Transform the file generated by the Pulsar Perf.
./HistogramLogProcessor -i <hgrm file path that pulsar-perf generated> -o <output file> -
You will get two output files. Upload the output file with the filename extension of .hgrm to the HdrHistogram Plotter.
-
Check the test result through the Graphical User Interface of the HdrHistogram Plotter, as shown below.