Pulsar Perf
The Pulsar Perf is a built-in performance test tool for Apache Pulsar. You can use the Pulsar Perf to test message writing or reading performance. For detailed information about performance tuning, see here.
Produce messages
For the latest and complete information about pulsar-perf, including commands, flags, descriptions, and more, see pulsar-perf.
-
This example shows how the Pulsar Perf produces messages with default options.
Input
bin/pulsar-perf produce my-topicAfter the command is executed, the test data is continuously output on the Console.
Output
19:53:31.459 [pulsar-perf-producer-exec-1-1] INFO  org.apache.pulsar.testclient.PerformanceProducer - Created 1 producers
19:53:31.482 [pulsar-timer-5-1] WARN  com.scurrilous.circe.checksum.Crc32cIntChecksum - Failed to load Circe JNI library. Falling back to Java based CRC32c provider
19:53:40.861 [main] INFO  org.apache.pulsar.testclient.PerformanceProducer - Throughput produced:     93.7  msg/s ---      0.7 Mbit/s --- failure      0.0 msg/s --- Latency: mean:   3.575 ms - med:   3.460 - 95pct:   4.790 - 99pct:   5.308 - 99.9pct:   5.834 - 99.99pct:   6.609 - Max:   6.609
19:53:50.909 [main] INFO  org.apache.pulsar.testclient.PerformanceProducer - Throughput produced:    100.0  msg/s ---      0.8 Mbit/s --- failure      0.0 msg/s --- Latency: mean:   3.437 ms - med:   3.328 - 95pct:   4.656 - 99pct:   5.071 - 99.9pct:   5.519 - 99.99pct:   5.588 - Max:   5.588
19:54:00.926 [main] INFO  org.apache.pulsar.testclient.PerformanceProducer - Throughput produced:    100.0  msg/s ---      0.8 Mbit/s --- failure      0.0 msg/s --- Latency: mean:   3.376 ms - med:   3.276 - 95pct:   4.520 - 99pct:   4.939 - 99.9pct:   5.440 - 99.99pct:   5.490 - Max:   5.490
19:54:10.940 [main] INFO  org.apache.pulsar.testclient.PerformanceProducer - Throughput produced:    100.0  msg/s ---      0.8 Mbit/s --- failure      0.0 msg/s --- Latency: mean:   3.298 ms - med:   3.220 - 95pct:   4.474 - 99pct:   4.926 - 99.9pct:   5.645 - 99.99pct:   5.654 - Max:   5.654
19:54:20.956 [main] INFO  org.apache.pulsar.testclient.PerformanceProducer - Throughput produced:    100.1  msg/s ---      0.8 Mbit/s --- failure      0.0 msg/s --- Latency: mean:   3.308 ms - med:   3.199 - 95pct:   4.532 - 99pct:   4.871 - 99.9pct:   5.291 - 99.99pct:   5.323 - Max:   5.323
19:54:30.972 [main] INFO  org.apache.pulsar.testclient.PerformanceProducer - Throughput produced:    100.0  msg/s ---      0.8 Mbit/s --- failure      0.0 msg/s --- Latency: mean:   3.249 ms - med:   3.144 - 95pct:   4.437 - 99pct:   4.970 - 99.9pct:   5.329 - 99.99pct:   5.414 - Max:   5.414
19:54:40.987 [main] INFO  org.apache.pulsar.testclient.PerformanceProducer - Throughput produced:    100.0  msg/s ---      0.8 Mbit/s --- failure      0.0 msg/s --- Latency: mean:   3.435 ms - med:   3.361 - 95pct:   4.772 - 99pct:   5.150 - 99.9pct:   5.373 - 99.99pct:   5.837 - Max:   5.837
^C19:54:44.325 [Thread-1] INFO  org.apache.pulsar.testclient.PerformanceProducer - Aggregated throughput stats --- 7286 records sent --- 99.140 msg/s --- 0.775 Mbit/s
19:54:44.336 [Thread-1] INFO  org.apache.pulsar.testclient.PerformanceProducer - Aggregated latency stats --- Latency: mean:   3.383 ms - med:   3.293 - 95pct:   4.610 - 99pct:   5.059 - 99.9pct:   5.588 - 99.99pct:   5.837 - 99.999pct:   6.609 - Max:   6.609
From the above test data, you can get the throughput statistics and the write latency statistics. The aggregated statistics is printed when the Pulsar Perf is stopped. You can press Ctrl+C to stop the Pulsar Perf. After the Pulsar Perf is stopped, the HdrHistogram formatted test result appears under your directory. The document looks like
perf-producer-1589370810837.hgrm. You can also check the test result through HdrHistogram Plotter. For details about how to check the test result through HdrHistogram Plotter, see HdrHistogram Plotter. -
This example shows how the Pulsar Perf produces messages with the
transactionoption.Input
bin/pulsar-perf produce my-topic -r 10 -m 100 -txnOutput
2021-10-11T13:36:15,595+0800 INFO  [Thread-3] o.a.p.t.PerformanceProducer@499 - --- Transaction : 2 transaction end successfully ---0 transaction end failed --- 0.200 Txn/s

2021-10-11T13:36:15,614+0800 INFO  [Thread-3] o.a.p.t.PerformanceProducer@503 - Throughput produced:     100 msg ---      0.0 msg/s ---      0.1 Mbit/s  --- failure      0.0 msg/s --- Latency: mean:   3.067 ms - med:   3.104 - 95pct:   3.747 - 99pct:   4.619 - 99.9pct:   6.760 - 99.99pct:   6.760 - Max:   6.760

2021-10-11T13:36:15,710+0800 INFO  [pulsar-perf-producer-exec-46-1] o.a.p.t.PerformanceProducer@834 - Aggregated latency stats --- Latency: mean:   3.067 ms - med:   3.104 - 95pct:   3.747 - 99pct:   4.619 - 99.9pct:   6.760 - 99.99pct:   6.760 - 99.999pct:   6.760 - Max:   6.760

2021-10-11T13:36:29,976+0800 INFO  [Thread-4] o.a.p.t.PerformanceProducer@815 - --- Transaction : 2 transaction end successfully --- 0 transaction end failed --- 2 transaction open successfully --- 0 transaction open failed --- 12.237 Txn/s

2021-10-11T13:36:29,976+0800 INFO  [Thread-4] o.a.p.t.PerformanceProducer@824 - Aggregated throughput stats --- 102 records sent --- 4.168 msg/s --- 0.033 Mbit/s
Consume messages
For the latest and complete information about pulsar-perf, including commands, flags, descriptions, and more, see pulsar-perf.
-
This example shows how the Pulsar Perf consumes messages with default options.
Input
noteIf you have not created a topic (in this example, it is my-topic) before, the broker creates a new topic without partitions and messages, then the consumer can not receive any messages. Consequently, before using
pulsar-perf consume, make sure your topic has enough messages to consume.bin/pulsar-perf consume my-topicAfter the command is executed, the test data is continuously output on the Console.
Output
20:35:37.071 [main] INFO  org.apache.pulsar.testclient.PerformanceConsumer - Start receiving from 1 consumers on 1 topics
20:35:41.150 [pulsar-client-io-1-9] WARN  com.scurrilous.circe.checksum.Crc32cIntChecksum - Failed to load Circe JNI library. Falling back to Java based CRC32c provider
20:35:47.092 [main] INFO  org.apache.pulsar.testclient.PerformanceConsumer - Throughput received: 59.572  msg/s -- 0.465 Mbit/s --- Latency: mean: 11.298 ms - med: 10 - 95pct: 15 - 99pct: 98 - 99.9pct: 137 - 99.99pct: 152 - Max: 152
20:35:57.104 [main] INFO  org.apache.pulsar.testclient.PerformanceConsumer - Throughput received: 99.958  msg/s -- 0.781 Mbit/s --- Latency: mean: 9.176 ms - med: 9 - 95pct: 15 - 99pct: 16 - 99.9pct: 17 - 99.99pct: 18 - Max: 18
20:36:07.115 [main] INFO  org.apache.pulsar.testclient.PerformanceConsumer - Throughput received: 100.006  msg/s -- 0.781 Mbit/s --- Latency: mean: 9.316 ms - med: 9 - 95pct: 15 - 99pct: 16 - 99.9pct: 17 - 99.99pct: 17 - Max: 17
20:36:17.125 [main] INFO  org.apache.pulsar.testclient.PerformanceConsumer - Throughput received: 100.085  msg/s -- 0.782 Mbit/s --- Latency: mean: 9.327 ms - med: 9 - 95pct: 15 - 99pct: 16 - 99.9pct: 17 - 99.99pct: 17 - Max: 17
20:36:27.136 [main] INFO  org.apache.pulsar.testclient.PerformanceConsumer - Throughput received: 99.900  msg/s -- 0.780 Mbit/s --- Latency: mean: 9.404 ms - med: 9 - 95pct: 15 - 99pct: 16 - 99.9pct: 17 - 99.99pct: 17 - Max: 17
20:36:37.147 [main] INFO  org.apache.pulsar.testclient.PerformanceConsumer - Throughput received: 99.985  msg/s -- 0.781 Mbit/s --- Latency: mean: 8.998 ms - med: 9 - 95pct: 15 - 99pct: 16 - 99.9pct: 17 - 99.99pct: 17 - Max: 17
^C20:36:42.755 [Thread-1] INFO  org.apache.pulsar.testclient.PerformanceConsumer - Aggregated throughput stats --- 6051 records received --- 92.125 msg/s --- 0.720 Mbit/s
20:36:42.759 [Thread-1] INFO  org.apache.pulsar.testclient.PerformanceConsumer - Aggregated latency stats --- Latency: mean: 9.422 ms - med: 9 - 95pct: 15 - 99pct: 16 - 99.9pct: 98 - 99.99pct: 137 - 99.999pct: 152 - Max: 152
From the output test data, you can get the throughput statistics and the end-to-end latency statistics. The aggregated statistics are printed after the Pulsar Perf is stopped. You can press Ctrl+C to stop the Pulsar Perf.
-
This example shows how the Pulsar Perf consumes messages with the
transactionoption.Input
bin/pulsar-perf consume my-topic -r 10 -txn -ss mysubName -st Exclusive -sp Earliest -ntxn 10noteIf you have not created a topic (in this example, it is my-topic) before, the broker creates a new topic without partitions and messages, then the consumer can not receive any messages. Consequently, before using
pulsar-perf consume, make sure your topic has enough messages to consume.Output
2021-10-11T13:43:36,052+0800 INFO  [Thread-3] o.a.p.t.PerformanceConsumer@538 - --- Transaction: 6 transaction end successfully --- 0 transaction end failed --- 0.199  Txn/s --- AckRate: 9.952 msg/s

2021-10-11T13:43:36,065+0800 INFO  [Thread-3] o.a.p.t.PerformanceConsumer@545 - Throughput received:     306 msg --- 9.952  msg/s -- 0.000 Mbit/s  --- Latency: mean: 26177.380 ms - med: 26128 - 95pct: 30531 - 99pct: 30923 - 99.9pct: 31021 - 99.99pct: 31021 - Max: 31021

2021-10-11T13:43:59,854+0800 INFO  [Thread-5] o.a.p.t.PerformanceConsumer@579 - -- Transaction: 10  transaction end successfully --- 0 transaction end failed --- 10 transaction open successfully --- 0 transaction open failed --- 0.185 Txn/s

2021-10-11T13:43:59,854+0800 INFO  [Thread-5] o.a.p.t.PerformanceConsumer@588 - Aggregated throughput stats --- 505 records received --- 9.345 msg/s --- 0.000 Mbit/s--- AckRate: 9.27065308842743  msg/s --- ack failed 4 msg

2021-10-11T13:43:59,882+0800 INFO  [Thread-5] o.a.p.t.PerformanceConsumer@601 - Aggregated latency stats --- Latency: mean: 50593.000 ms - med: 50593 - 95pct: 50593 - 99pct: 50593 - 99.9pct: 50593 - 99.99pct: 50593 - 99.999pct: 50593 - Max: 50593
Transactions
This section shows how Pulsar Perf runs transactions. For more information, see Pulsar transactions.
Use transaction
This example executes 50 transactions. Each transaction sends and receives 1 message (default).
Input
bin/pulsar-perf transaction --topics-c myConsumerTopic --topics-p MyproduceTopic -threads 1 -ntxn 50 -ss testSub -nmp 1 -nmc 1
If you have not created a topic (in this example, it is myConsumerTopic) before, the broker creates a new topic without partitions and messages, then the consumer can not receive any messages. Consequently, before using pulsar-perf transaction, make sure your topic has enough messages to consume.
Output
2021-10-11T14:37:27,863+0800 INFO  [Thread-5] o.a.p.t.PerformanceProducer@613 - Messages ack aggregated latency stats --- Latency: mean:  29.239 ms - med:  26.799 - 95pct:  46.696 - 99pct:  55.660 - 99.9pct:  55.660 - 99.99pct:  55.660 - 99.999pct:  55.660 - Max:  55.660 {}

2021-10-11T14:37:19,391+0800 INFO  [Thread-4] o.a.p.t.PerformanceProducer@525 - Throughput transaction:      50 transaction executes ---   4.999 transaction/s  ---send Latency: mean:  31.368 ms - med:  28.369 - 95pct:  55.631 - 99pct:  57.764 - 99.9pct:  57.764 - 99.99pct:  57.764 - Max:  57.764---ack Latency: mean:  29.239 ms - med:  26.799 - 95pct:  46.696 - 99pct:  55.660 - 99.9pct:  55.660 - 99.99pct:  55.660 - Max:  55.660 {}

2021-10-11T14:37:26,625+0800 INFO  [Thread-5] o.a.p.t.PerformanceProducer@571 - Aggregated throughput stats --- 50 transaction executed ---   2.718 transaction/s  --- 50 transaction open successfully --- 0 transaction open failed --- 50 transaction end successfully --- 0 transaction end failed--- 0 message ack failed --- 0 message send failed--- 50 message ack success --- 50 message send success  {}
Disable Transaction
This example disables transactions.
Input
bin/pulsar-perf transaction --topics-c myConsumerTopic --topics-p myproduceTopic -threads 1 -ntxn 50 -ss testSub --txn-disEnable
If you have not created a topic (in this example, it is myConsumerTopic) before, the broker creates a new topic without partitions and messages, then the consumer can not receive any messages. Consequently, before using pulsar-perf transaction --txn-disEnable, make sure your topic has enough messages to consume.
Output
2021-10-11T16:48:26,876+0800 INFO  [Thread-4] o.a.p.t.PerformanceProducer@529 - Throughput task:      50 task executes ---   4.999 task/s  ---send Latency: mean:  10.002 ms - med:   9.875 - 95pct:  11.733 - 99pct:  15.995 - 99.9pct:  15.995 - 99.99pct:  15.995 - Max:  15.995---ack Latency: mean:   0.051 ms - med:   0.020 - 95pct:   0.059 - 99pct:   1.377 - 99.9pct:   1.377 - 99.99pct:   1.377 - Max:   1.377

2021-10-11T16:48:29,222+0800 INFO  [Thread-5] o.a.p.t.PerformanceProducer@617 - Messages ack aggregated latency stats --- Latency: mean:   0.051 ms - med:   0.020 - 95pct:   0.059 - 99pct:   1.377 - 99.9pct:   1.377 - 99.99pct:   1.377 - 99.999pct:   1.377 - Max:   1.377

2021-10-11T16:48:29,246+0800 INFO  [Thread-5] o.a.p.t.PerformanceProducer@629 - Messages send aggregated latency stats --- Latency: mean:  10.002 ms - med:   9.875 - 95pct:  11.733 - 99pct:  15.995 - 99.9pct:  15.995 - 99.99pct:  15.995 - 99.999pct:  15.995 - Max:  15.995

2021-10-11T16:48:29,117+0800 INFO  [Thread-5] o.a.p.t.PerformanceProducer@602 - Aggregated throughput stats --- 50 task executed --- 4.025 task/s --- 0 message ack failed --- 0 message send failed--- 50 message ack success --- 50 message send success
Configurations
By default, the Pulsar Perf uses conf/client.conf as the default configuration and uses conf/log4j2.yaml as the default Log4j configuration. If you want to connect to other Pulsar clusters, you can update the brokerServiceUrl in the client configuration.
You can use the following commands to change the configuration file and the Log4j configuration file.
export PULSAR_CLIENT_CONF=<your-config-file>
export PULSAR_LOG_CONF=<your-log-config-file>
In addition, you can use the following command to configure the JVM configuration through environment variables:
export PULSAR_EXTRA_OPTS='-Xms4g -Xmx4g -XX:MaxDirectMemorySize=4g'
HdrHistogram Plotter
The HdrHistogram Plotter is a visualization tool for checking Pulsar Perf test results, which makes it easier to observe the test results.
To check test results through the HdrHistogram Plotter, follow these steps:
-
Clone the HdrHistogram repository from GitHub to the local.
git clone https://github.com/HdrHistogram/HdrHistogram.git -
Switch to the HdrHistogram folder.
cd HdrHistogram -
Install the HdrHistogram Plotter.
mvn clean install -DskipTests -
Transform the file generated by the Pulsar Perf.
./HistogramLogProcessor -i <hgrm file path that pulsar-perf generated> -o <output file> -
You will get two output files. Upload the output file with the filename extension of .hgrm to the HdrHistogram Plotter.
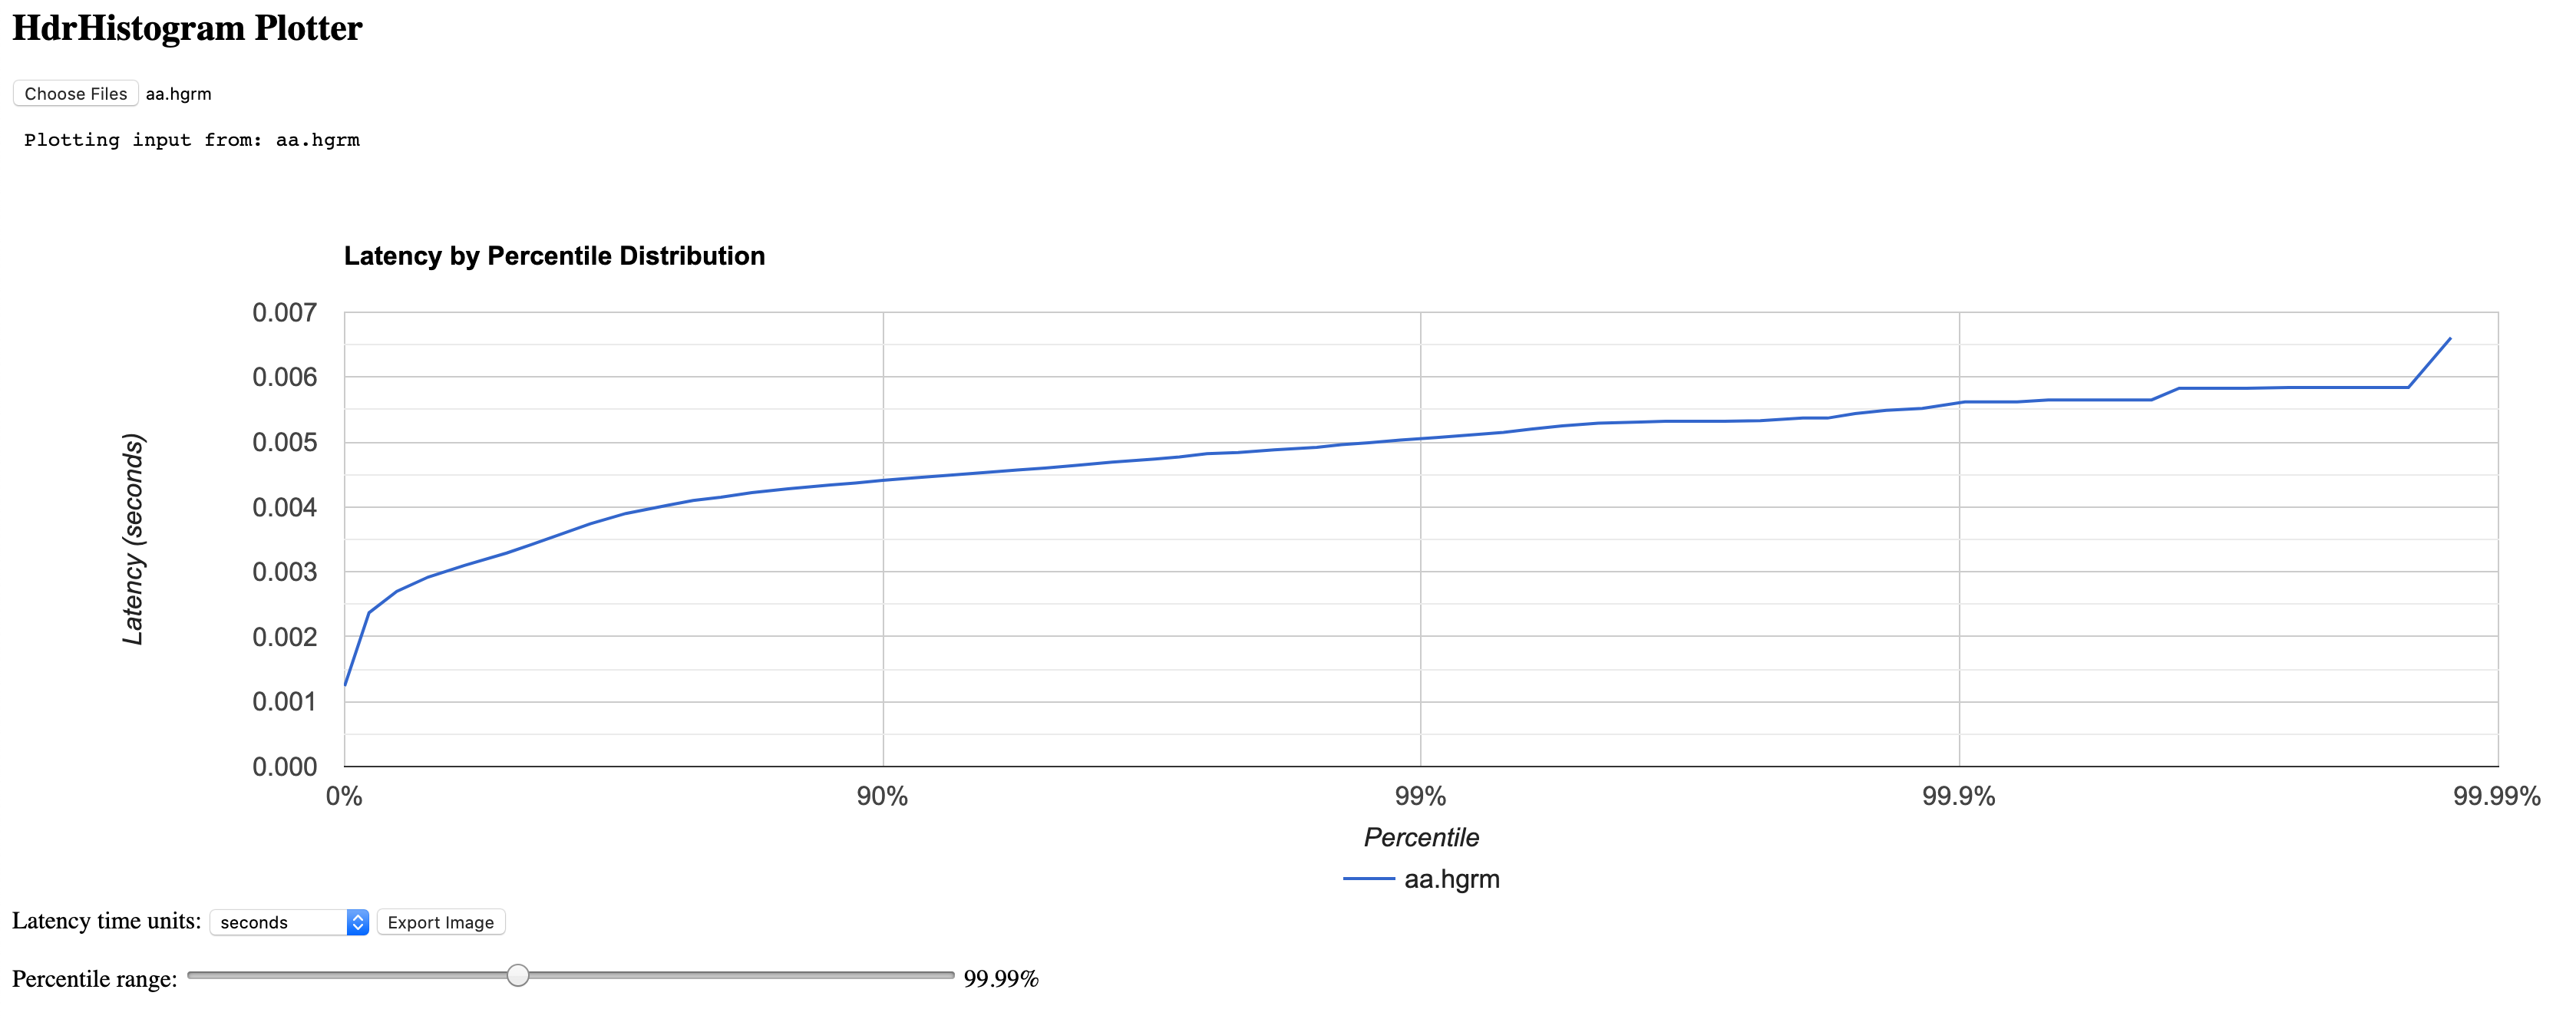
-
Check the test result through the Graphical User Interface of the HdrHistogram Plotter, as shown below.